What is Logstash? Logstash is basically a data collection engine (which, in this example we’ll use it to collect data from our Java Log4J logs).
We will be using Elastic Stack (Elasticsearch, Logstash and Kibana) on Mac OS X in this tutorial.
Before we proceed, we’ll need the following:
Optional:
1 . Extract Filebeat into the server where your Java application server resides
2 . Open up filebeat.yml
3 . Under the filebeat –> prospectors, add the following config:
 -
  paths:
    - /var/log/yourApp/yourlog*
  type: log
  fields:
    application: your-app
4 . Under the output section, enter your Logstash host. It should look something like this hosts: ["localhost:5044"]. You can change the index name by adding index: your_index in the same Logstash section.
5 . Extract Logstash to your Logstash server. This can be in the same machine as Filebeat if you like.
6 . In your Logstash server, create logstash.conf in the Logstash application folder.
7 . Put the following into your config file.
# The # character at the beginning of a line indicates a comment. Use
# comments to describe your configuration.
input {
  beats {
    port => 5044
    type => "log4j"
    codec => multiline {
      # Grok pattern names are valid!
      pattern => "^%{TIMESTAMP_ISO8601} "
      negate => true
      what => previous
    }
  }

  # optional: add this section if you want Logstash to collect data from a table eg. audit table....
  # if not, comment or remove this section
  jdbc {
    # Postgres jdbc connection string to our database, mydb
    jdbc_connection_string => "jdbc:postgresql://localhost:5432/yourdatabase"
    # The user we wish to execute our statement as
    jdbc_user => "your_postgres_username"
    jdbc_password => "your_postgres_password"
    # The path to our downloaded jdbc driver
    jdbc_driver_library => "postgresql-9.3-1102-jdbc41.jar"
    # The name of the driver class for Postgresql
    jdbc_driver_class => "org.postgresql.Driver"
    # our query
    statement => "SELECT * from your_audit_table"
  }
}

output {
  stdout { codec => json_lines }

  elasticsearch {
    # point to your elasticsearch host
    hosts => ["localhost:9200"]
    index => "%{[@metadata][beat]}-%{+YYYY.MM.dd}"
    document_type => "%{[@metadata][type]}"
  }
}
8 . Extract Elasticsearch and run bin/elasticsearch
9 . Go to the Logstash application folder that you’ve extracted and run bin/logstash -f logstash.conf
10 . Go to your FileBeat folder and import the template into your Elasticsearch by running curl -XPUT 'http://localhost:9200/_template/filebeat?pretty' -d@filebeat.template.json
11 . Now, we run FileBeat to delivery the logs to Logstash by running sudo ./filebeat -e -c filebeat.yml -d "publish"
12 . We need a front end to view the data that’s been feed into Elasticsearch. Hence we’ll need Kibana. Extract Kibana and edit config/kibana.yml.
13 . If your Elasticsearch resides on another server, uncomment elasticsearch.url .
14 . Now close the file and run Kibana with bin/kibana
15 . Open up http://localhost:5601 and you’ll be asked to enter your index name. Use the index name from step 4. For example yourIndex-* .
16 . Once that is done, go to the Discover tab and change the time frame on the top right corner.
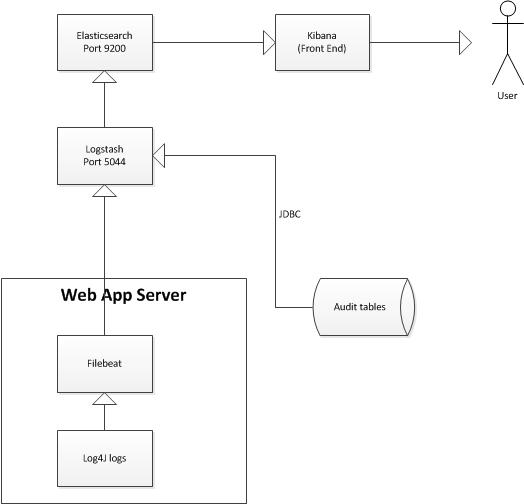
Your overall architecture should look something like this: